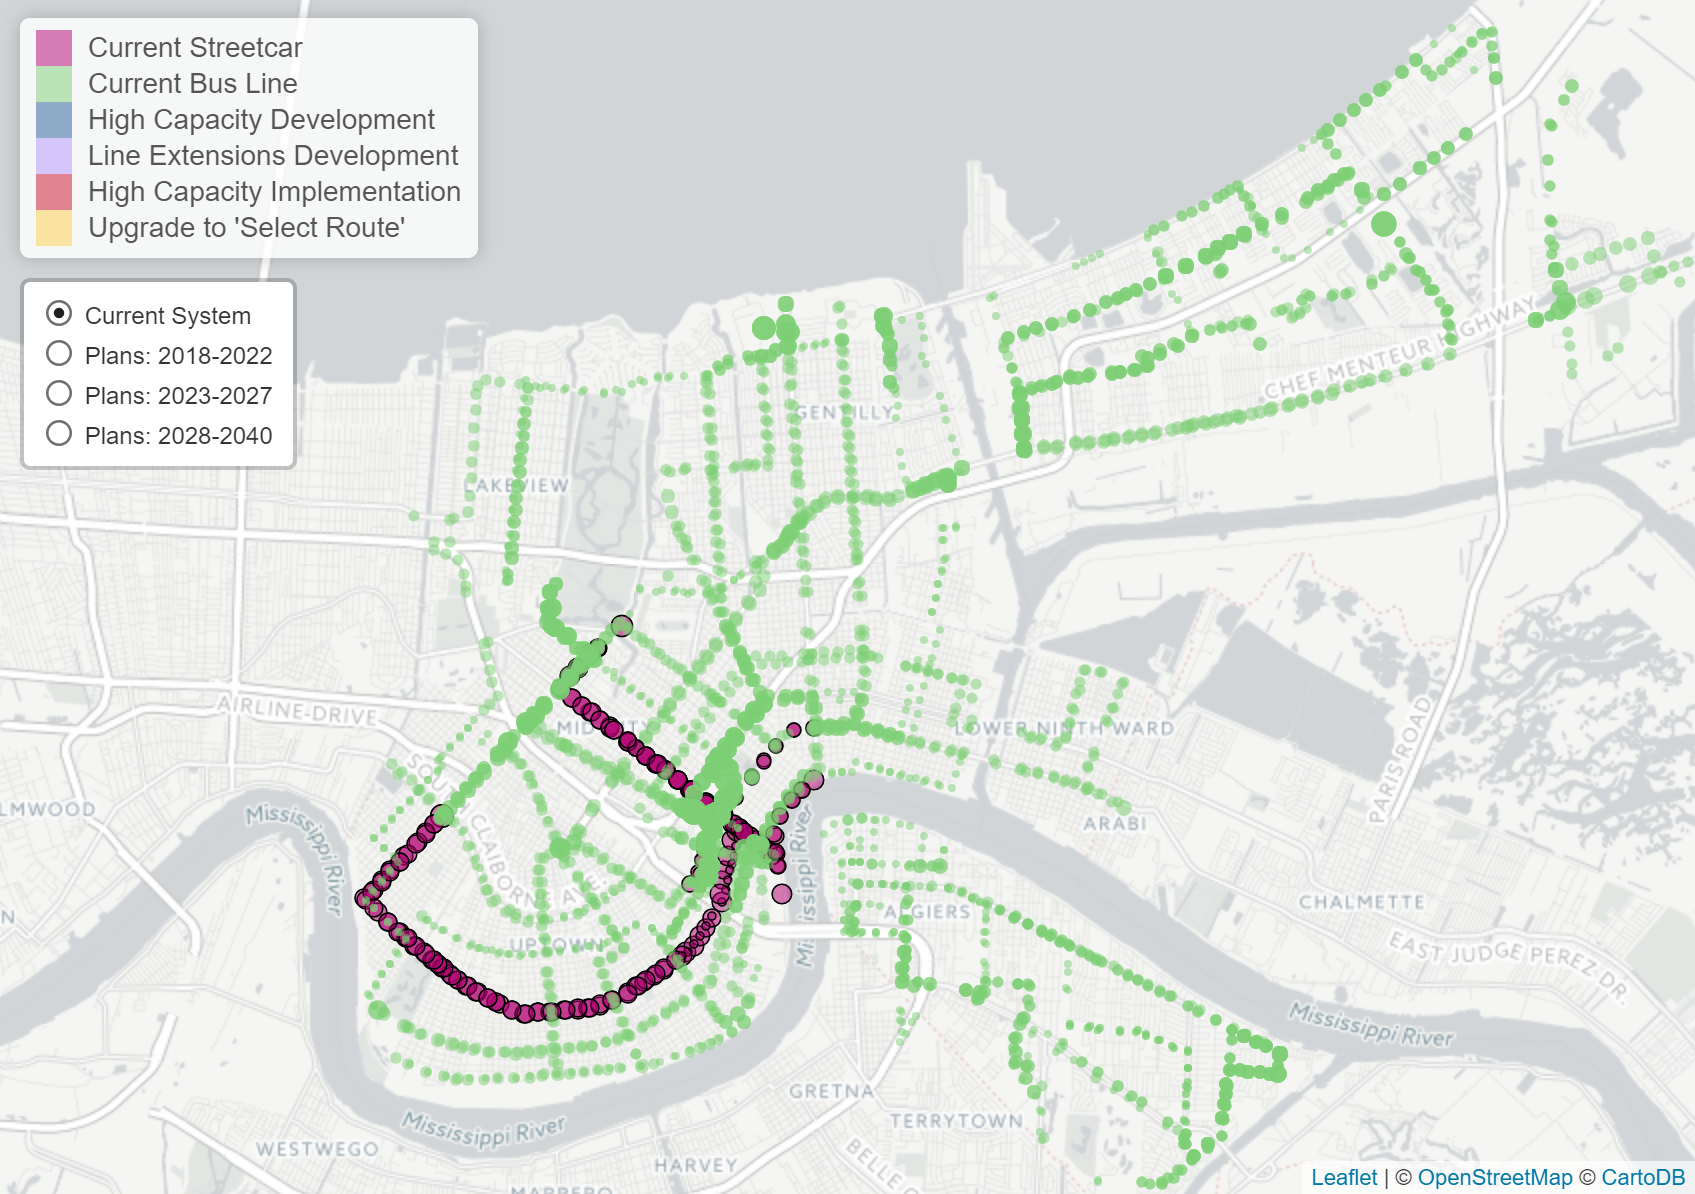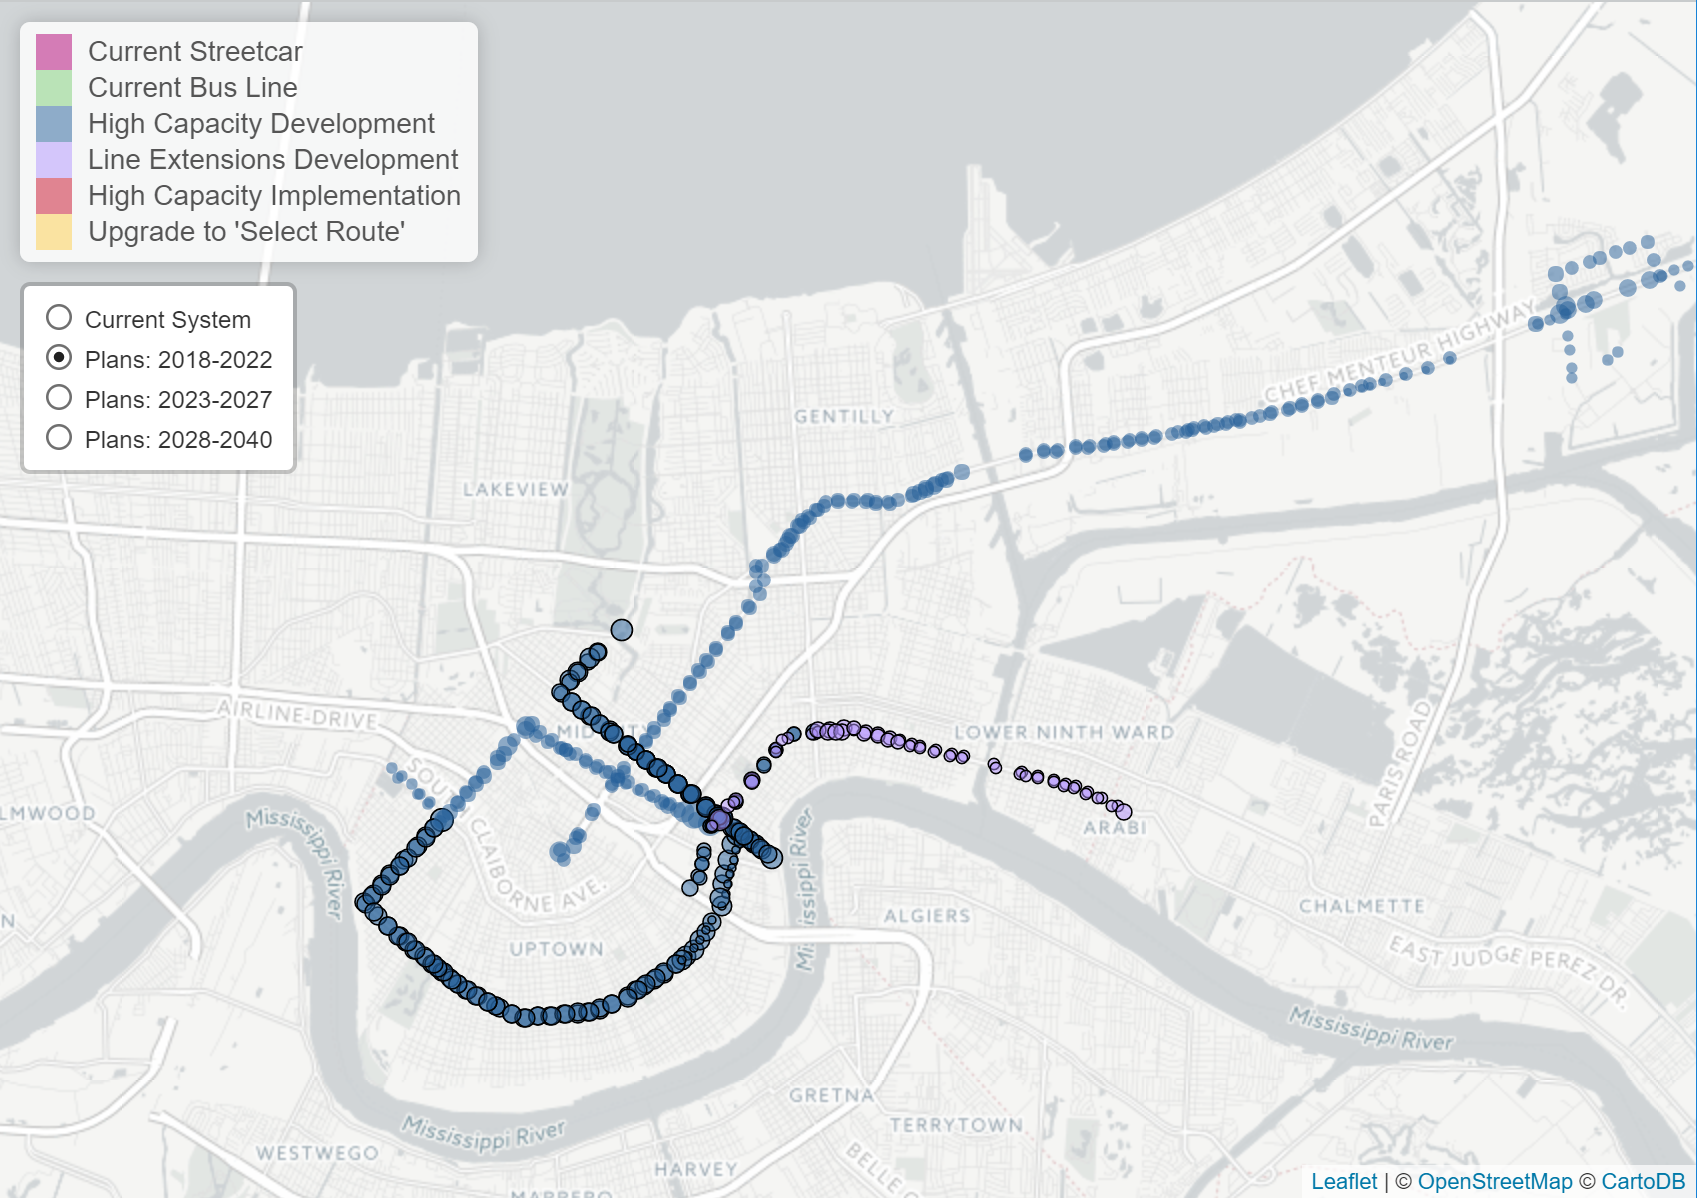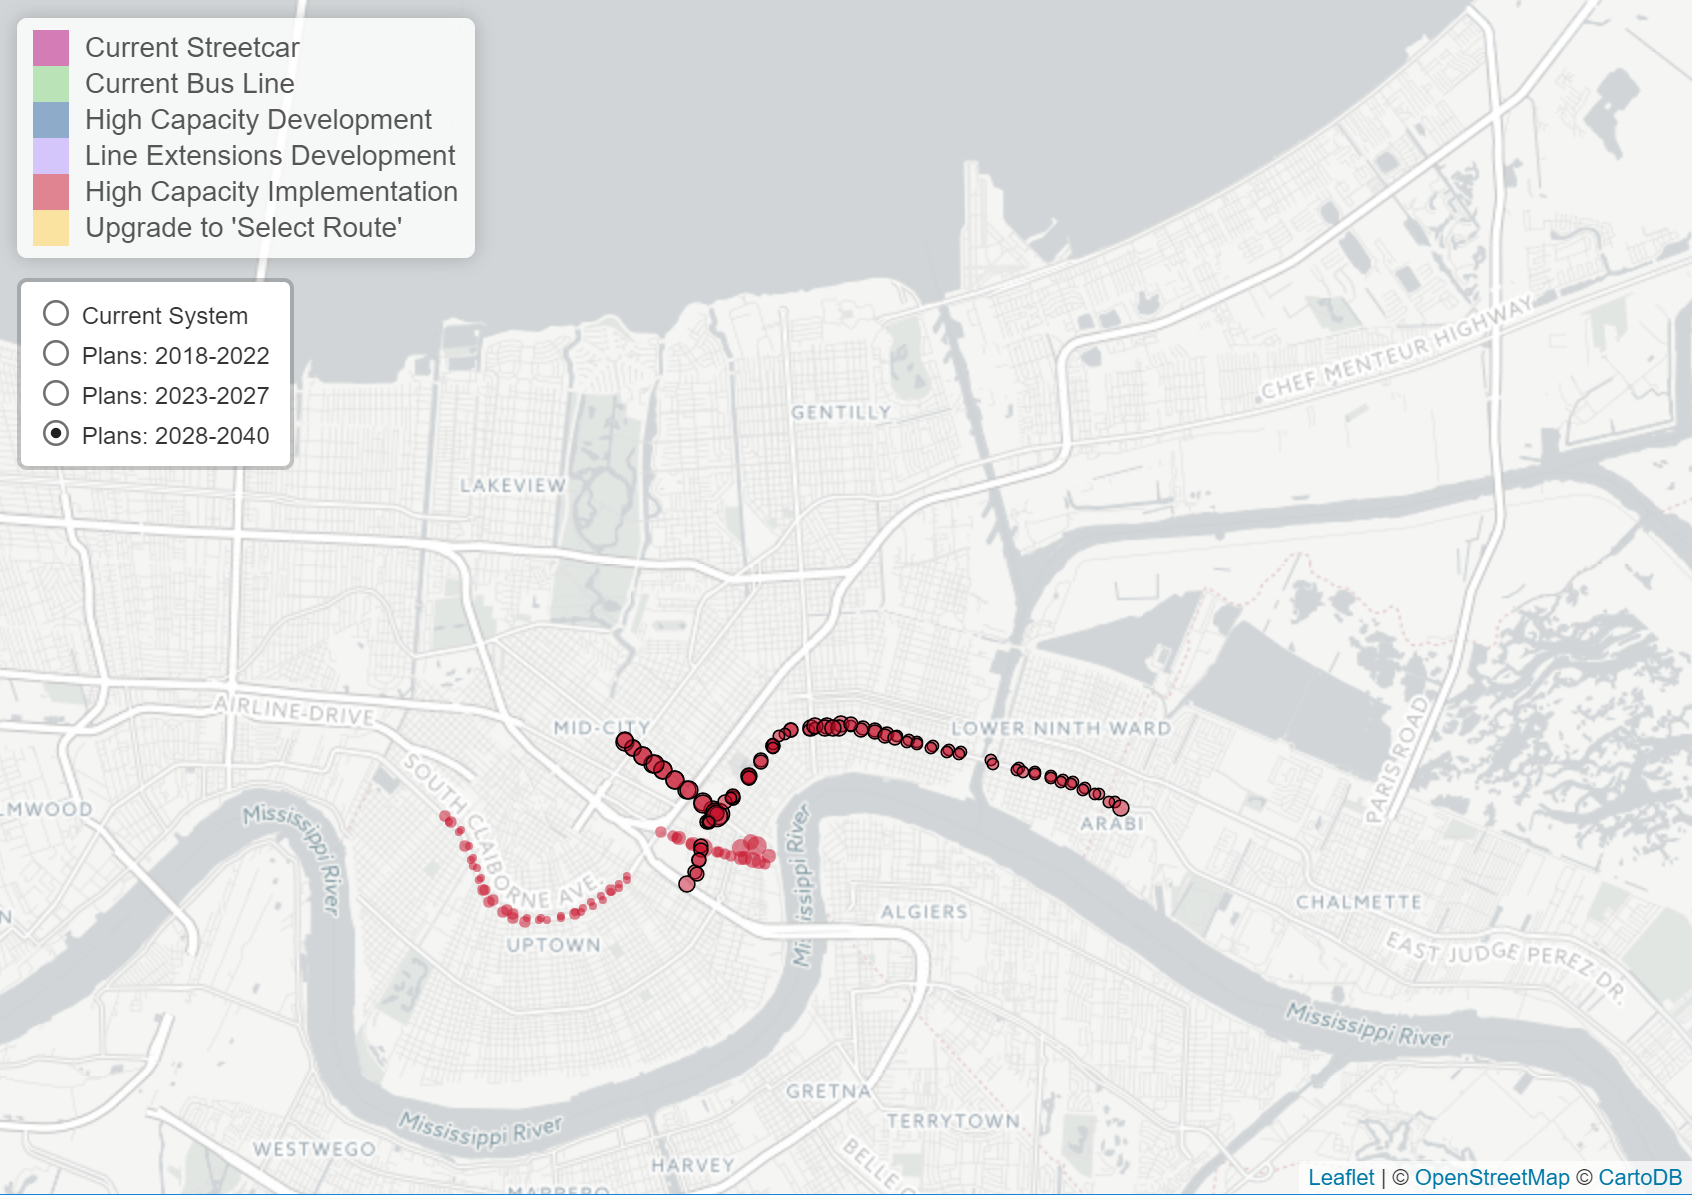


Legend:
- Points represent stops (excluding Kenner).
- Sizes of points shows frequency of stops (larger circle indicates higher frequency).
- Black borders indicate streetcar stops.
Source(s): RTA Data available upon request from http://www.norta.com/Business-Center/Developer-Information
To obtain an interactive version of this map, email us at info@fluxrme.com.
1. There is a simmering controversy in New Orleans...
The so-called ‘two New Orleans’ debate argues that many economically disadvantaged citizens, particularly African Americans, are being left behind as New Orleans becomes whiter and more inequitable.
2. Decisionmaking around transit is an important piece of this conversation.
The RTA has felt heat from some claiming that new developments are focused on costly streetcar lines for tourists, while failing to dedicate the same scale of resources to the bus lines that locals heavily rely on.
3. The RTA has released its long-awaited draft of their 2018-2040 Strategic Mobility Plan
The plan spans the next 22 years, with a public forum meeting scheduled which occurred yesterday and potentially more to come.
4. So let’s take a data-driven look at how it pans out for transit equity.
Rather than just read the surface-level draft, we here at Flux prefer to contextualize, discuss, and above all analyze whatever it is we’re looking at. And given that the data is available to do so, what better way than a fun visualization?
5. The data demonstrate that opportunities to increase equity in NOLA public transit are not receiving enough attention.
A first pass shows that the draft includes bold ideas for the development of high capacity transit corridors at various points across the city. At the same time, it’s easy to see that currently the most heavily serviced lines in the city are the downtown area and the St. Charles and Canal St. Streetcar lines. Gentilly, the West Bank, and the Lower 9th Ward, receive infrequent service, and large swaths of the city, such as Hollygrove and Broadmoor, have next to no transit.
Looking at the results of the draft plan, we can clearly see that the RTAs immediate focus for improving service is….the expansion and capacity increase of existing streetcar lines. Hmmm.
6. There are some points to be celebrated.
To be fair, expanding Broad/Gentill/Chef Menteur busway will create a high-capacity thoroughfare that cuts through much of the city, and the strategy also lays out plans for high-capacity corridors in Elmwood/Claiborne, Veterans/Airport, and the Westbank Expressway (the details of these are unavailable).
7. But in the long run, tourists seem to win out a lot more than locals.
What is odd is that the Strategic Mobility calls for preparing and implementing a network re-design between 2018 and 2022, while at the same time preparing to build a French Quarter Streetcar Line, a CBD Streetcar Line, and to upgrade the 1.5-mile-long, already-frequent Riverfront Streetcar line into a “select route” (what exactly this means is unclear).
8. To move forwards, we need more transparency in decision-making.
The first step is to get a clear understanding as to the RTAs reasoning for a potentially controversial expansion of Streetcars in light of the need for a network re-design.
- What was their methodology in picking new routes?
- Did they examine census data to try and link income levels, lack of essential services (such as grocery stores and hospitals), and restricted vehicle access in certain neighborhoods to identify potentially untapped and underserved areas?
- Or did they narrow their focus to the performance of existing routes?
- Why are heavily serviced lines (i.e. the St. Charles and Canal St. Streetcar) prioritized for the first wave of upgrades over, for example, improving the Claiborne line connecting Hollygrove and Broadmoor with Downtown?
9. And as a city, we owe it to ourselves to encourage data-driven feedback is a part of this decision-making process.
The next (and undoubtedly related) step is to ensure that in future high-impact decisions made for public services, the city focuses on transparent, data-driven decision making to ensure equitable results for those in the city who are struggling.
10. Inequity has many forms. Used thoughtfully, data = hope for our city. One New Orleans.
Finally, this exercise highlights the need for effective policy evaluation in general. Flux is excited at the potential there is for data to inspire a more equitable city.
Data + Reflection = Learning + Resilience + Dignity
Interested in joining the conversation?
Email Robert at robert.l.stickney@gmail.com or Flux at info@fluxrme.com.

